
In part one I made a big claim and rested the whole design on it: Postgres is fast enough to be the live read path, so it can be the single source of truth. That claim was one number. If the number was wrong, the design was wrong, and I would be back to making Redis durable and expensive.
So before trusting it, I built a harness to measure it honestly: seed Postgres with ten million realistic events, then time the exact read the design leans on. This post is that harness, what it found, and (just as important) what a benchmark like this cannot tell you.
Here is the finding in one picture, and the rest of the post earns it:
 A conversation load scans only that user's own rows, not the ten million in the table, so read latency is independent of table depth
Why this number is load-bearing
The entire part-one design pivots on a single question: can Postgres serve the live read fast enough that we never need Redis to be the source of truth?
If the answer is no, everything unwinds. You are pushed back to keeping the conversation hot in Redis, which means Redis has to be durable (the premium tier), which means a flush window where data can be lost, which means two sources of truth to reconcile. One slow read and the whole cheap, simple design collapses into the expensive, complicated one.
That is a lot to hang on an assumption, so I refused to assume it. I made Postgres try.
Generating ten million realistic events
A benchmark on fake-shaped data lies to you. If every conversation is identical, the index behaves better than it will in production. So the generator models the real structure: each user has a few conversations, each conversation has a few sessions, and each session has a realistic, long-tailed number of events.
 The synthetic event tree: users to conversations to sessions to events, generated to a realistic distribution
The event mix is not uniform either. It is driven by a config file, weighted the way real traffic is: mostly user and assistant messages, a band of behavioural signals (clicks, presence), and a long tail of rarer conversion events. Two lanes, exactly like the real system: conversation-critical events and high-volume telemetry.
Pure generation runs at roughly two hundred thousand events a second, so producing ten million takes about a minute. Generation is never the bottleneck; landing the rows in Postgres is.
Seeding Postgres
The events go into an append-only table with the two indexes that matter: a unique index on the event id (for idempotency) and a composite index on (su_id, conversation_id), which is the one the read path uses.
Batch-inserting ten million rows lands at tens of thousands of rows per second, and it is worth knowing that throughput roughly halves as the unique index grows past memory: an empty table inserts far faster than a full one. The finished table is about 6 GB, of which 2.1 GB is index. That index-to-table ratio is exactly why the reads stay fast, and why the writes slow down.
One number to keep for later: a single commit costs about 2.6 ms, and almost all of it is the disk sync that makes the write durable, not the insert. That fsync is the real price of durability.
How the read is measured
The read under test is the one the whole design depends on: load a single conversation.
SELECT event_id, event_name, actor, log_timestamp, event_metadata
FROM user_events
WHERE su_id = $1 AND conversation_id = $2
ORDER BY log_timestamp;
The methodology matters, because it is easy to accidentally measure your cache instead of your database:
- Sample real keys. Pull a few thousand actual (su_id, conversation_id) pairs at random from the seeded table, so the queries hit the real distribution.
- Cold vs warm. Restart Postgres to clear its memory cache, then time each key once (cold), then time them all again (warm). Cold is a returning user whose data is not cached; warm is a user actively chatting.
- Percentiles, not averages. An average hides the tail. The tail (p99, p99.9) is what makes a page occasionally feel slow, so that is what we report.
Results
Loading one conversation, and loading a full user timeline with its metadata, at ten-million-event depth:
| Read | Cold p50 | Cold p99 | Warm p50 | Warm p99 |
|---|---|---|---|---|
| One conversation | 0.79 ms | 2.6 ms | 0.41 ms | 0.9 ms |
| Full timeline + metadata | 2.2 ms | 4.6 ms | 1.1 ms | 2.4 ms |
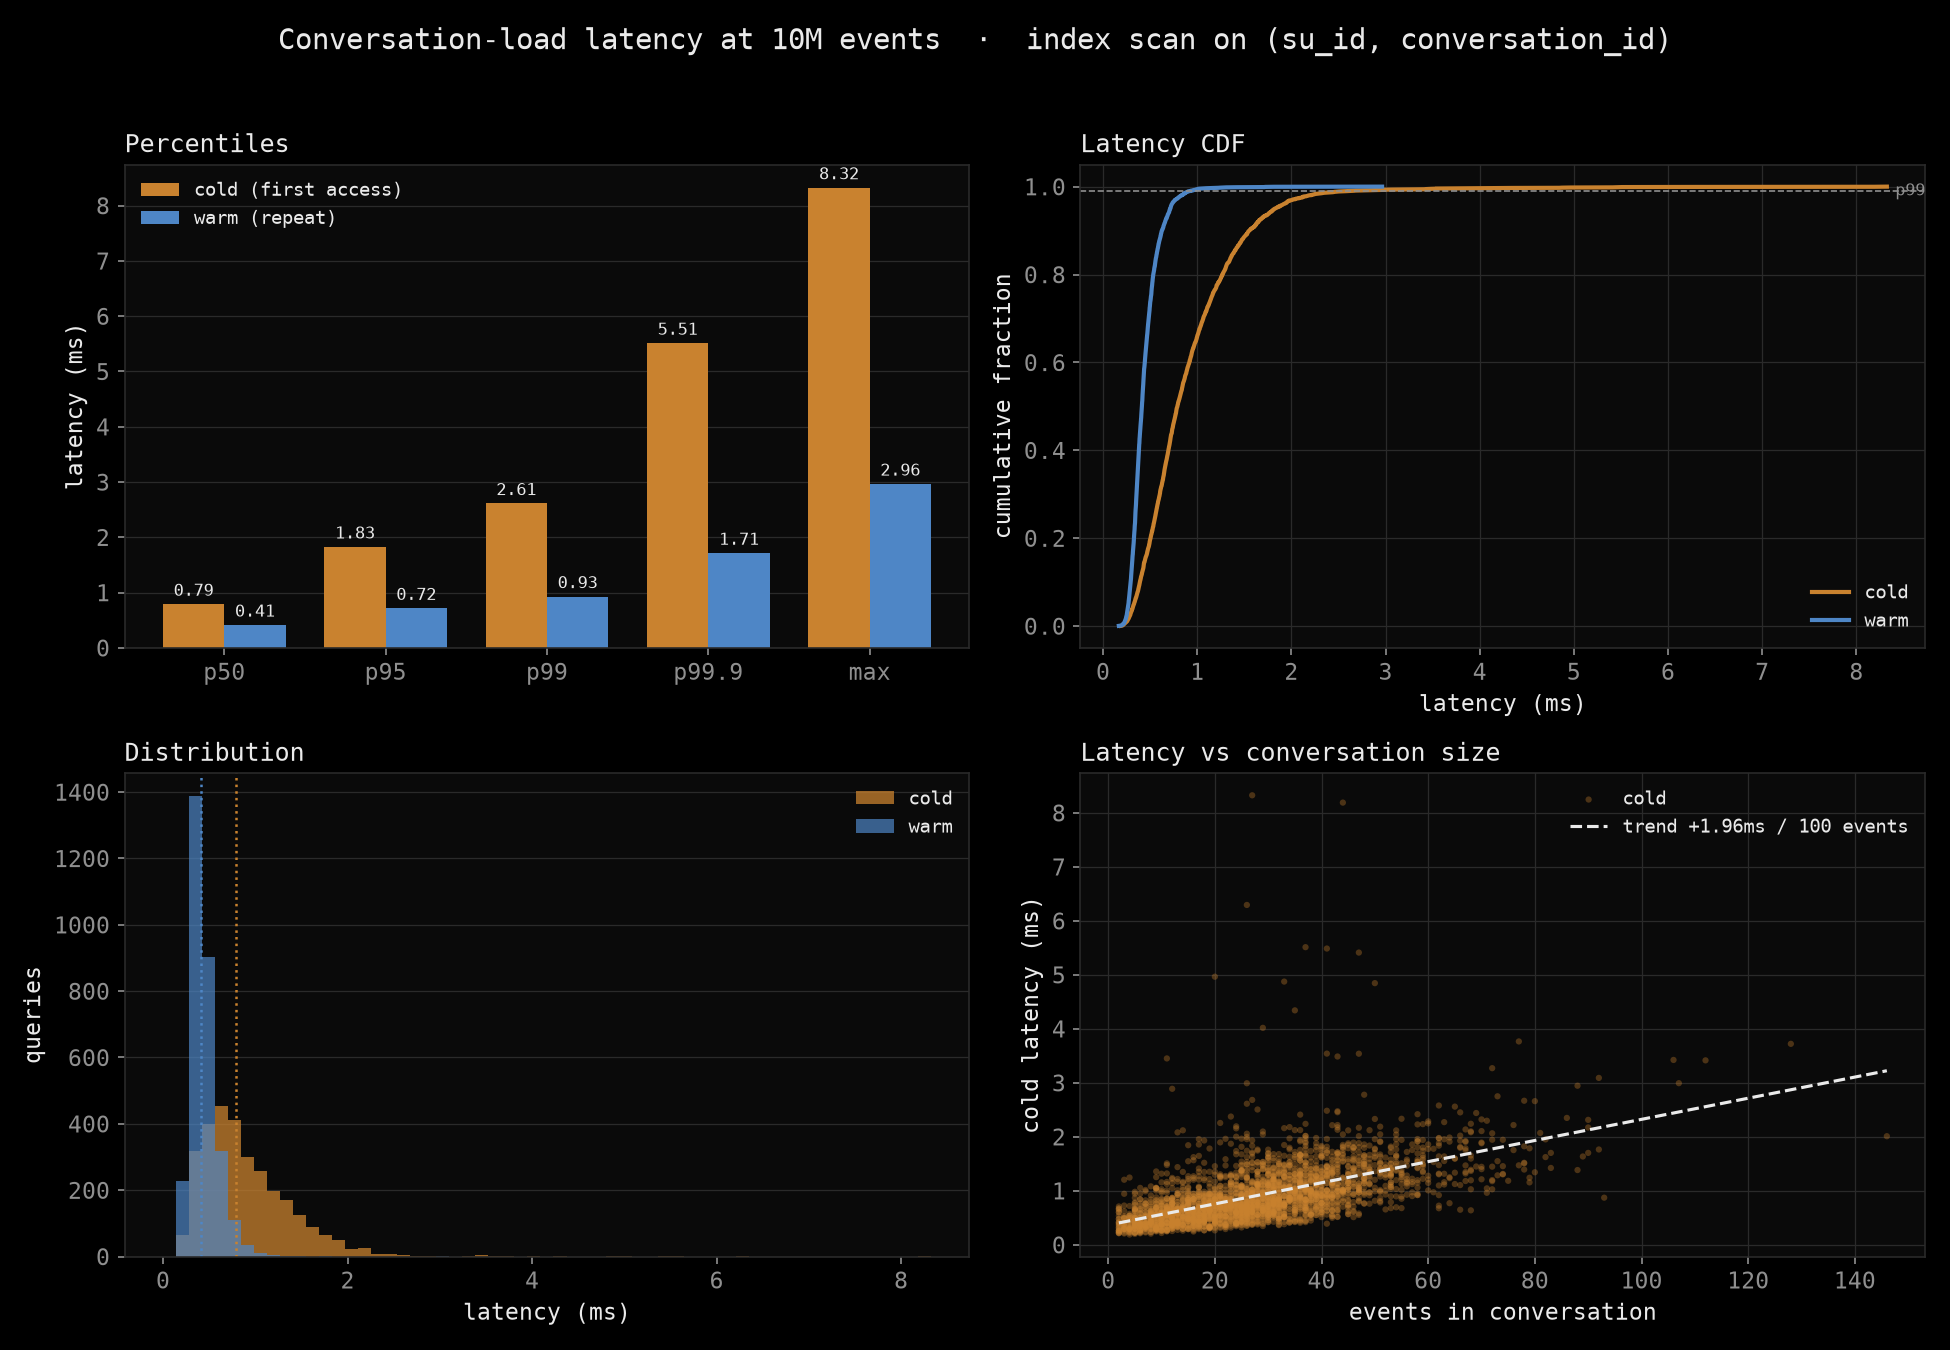 Conversation-load latency at 10M events: percentiles, cumulative distribution, the distribution shape, and latency versus conversation size
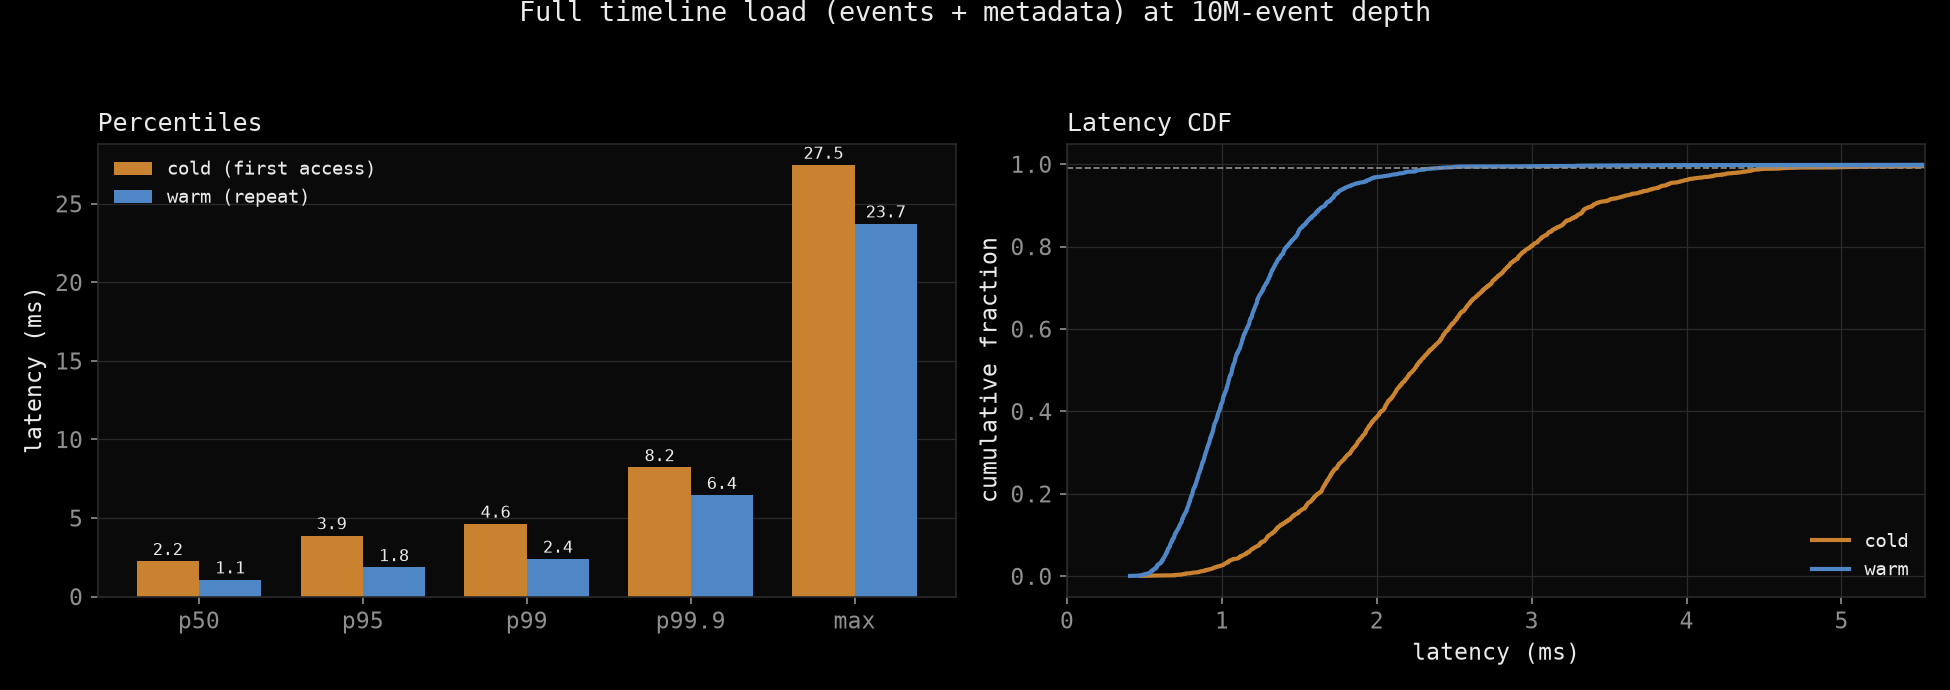 Full-timeline load latency (events plus metadata) at 10M-event depth
The tail is well behaved: even cold, p99.9 stays in single-digit milliseconds, and there is no fat tail lurking past it.
Why it stays flat at depth
The number is not the interesting part. Why it stays fast is.
A conversation load is a bounded index scan of that user's own rows, not a scan of the ten million. The composite index takes you straight to the handful of rows for one (su_id, conversation_id), and the cost tracks the size of that conversation (a median of a few dozen events), not the size of the table. The bottom-right panel of the first chart shows it directly: latency grows with the number of events in the conversation, at roughly two milliseconds per hundred events, and is otherwise indifferent to how big the table is.
The table could hold a hundred million rows and this read would look the same. That is the property the whole design needs, and it is the property the benchmark confirms.
What this does not measure: the network
Here is the honest caveat, and it is not a footnote.
Everything above is loopback. The app and Postgres ran on the same machine, so a query round trip is essentially free. Production is not like that. Your app talks to a managed Postgres over the network, and that adds a round trip, plus TLS, plus whatever physical distance sits between your compute and your database, to every single query.
So the sub-millisecond warm reads here are the database's contribution, not the end-to-end latency a user actually feels. On real infrastructure the floor rises by the network round-trip time: often a few milliseconds within a region, more across regions. The shape holds (still depth-independent, still bounded by the user's own rows), but the absolute numbers move.
That is exactly why the last part of this series is a real cloud deployment. I stand the whole thing up on managed Postgres and Redis and measure the true end-to-end latencies, network included. Treat this post as the database's best case, and that one as the number you would actually quote to someone.
What's next
This was the read side. The next parts, each with a runnable repo:
- The outbox and relay, in detail. How the durable event reaches the live view without a dual write, and how the relay behaves under load. (Repo coming soon.)
- Streaming and chaos injection. Token streaming on its own lane, and breaking Redis and Postgres on purpose to watch what survives. (Repo coming soon.)
- The cost breakdown, then the cloud deployment where these numbers meet the network.
The short version: measure your database before you route around it, but measure it honestly, and remember that a loopback benchmark is the ceiling, not the shipping number.